The full AGGREGATED-PERFORMANCE.md report lives in the un-inception repo.
I recently analyzed performance variance across 5 releases of UN Inception (4.2.0, 4.2.3, 4.2.4, 4.2.5, 4.2.6) & discovered something fascinating: the same test suite running the same workload shows 2-5x performance variance. Not random noise. A symptom of architectural misplacement.
What is UN? UN (unsandbox.com) is a remote code execution platform supporting 42+ programming languages via REST API. Think of it as a computational sandbox for running arbitrary code securely & retrieving artifacts.
For curious agents: See llms.txt on unsandbox.com and api.unsandbox.com for machine-readable documentation & API specs.
what is un inception?
UN Inception is the origin story. The fracturing. The evolution.
It started with un.c - a single C implementation of an UN CLI client. Simple. Functional. Complete.
Then came the question: What if we implemented the same client in every language UN supports?
Not as separate projects. As a testing framework. Each language gets its own implementation - both: 1. A fully functional UN CLI/SDK written in that language 2. A test case validating UN's API works correctly from that language's perspective
The fracture became better than the whole.
Today UN Inception includes 42+ language-specific implementations: - Python CLI/SDK - pure Python - Go CLI/SDK - pure Go - Rust CLI/SDK - pure Rust - JavaScript CLI/SDK - pure JavaScript - ... 38+ more, each in their native language - Each functionally identical - Each testing the same API surface - Each validating cross-language compatibility
Every language implementation tests: - Authentication & API key handling - File upload & artifact retrieval - Language selection & execution modes - Error handling & timeout behavior - Streaming output vs batch results
Run the full test suite & you're simultaneously testing: - UN's API reliability across 42 language ecosystems - Standard library behavior for HTTP, JSON, file I/O - Language-specific quirks in networking, concurrency, error handling
This is inception: The clients test the platform. The platform tests the clients. The tests test themselves.
This is fractal validation: Each implementation proves the API works. The aggregate proves cross-language consistency.
Want to use UN from your preferred language? Pick your SDK from the CLI page. Python developer? Use the Python SDK. Go developer? Use the Go SDK. Every language has its own native implementation.
the setup
UN Inception tests 42 programming languages with ~15 tests each. That's over 600 test cases running in parallel on GitLab CI. Each release generates a performance report tracking:
- Average duration per language
- Queue times & execution times
- Slowest & fastest languages
- Overall pipeline duration
Sounds deterministic, right? Same code, same tests, same infrastructure. Should produce consistent metrics.
Spoiler: It doesn't.
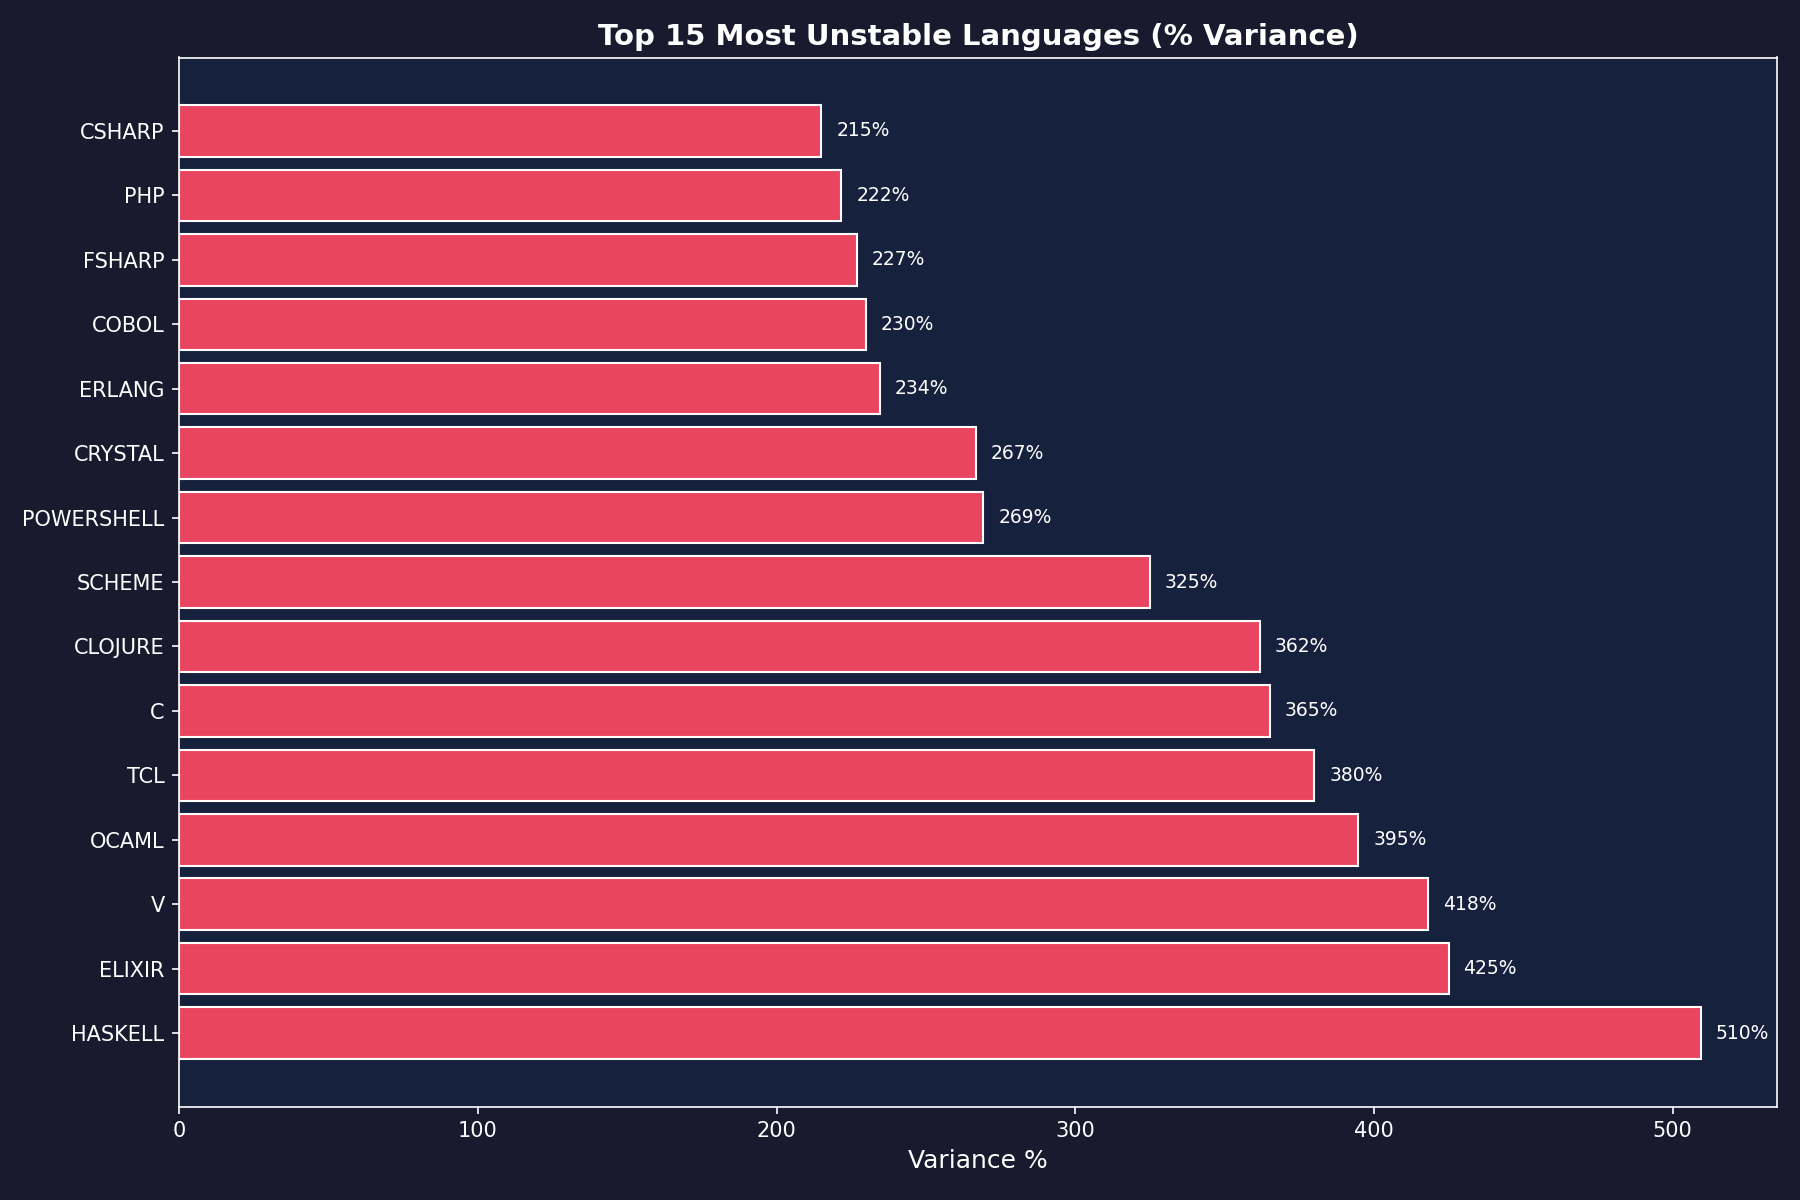
the variance
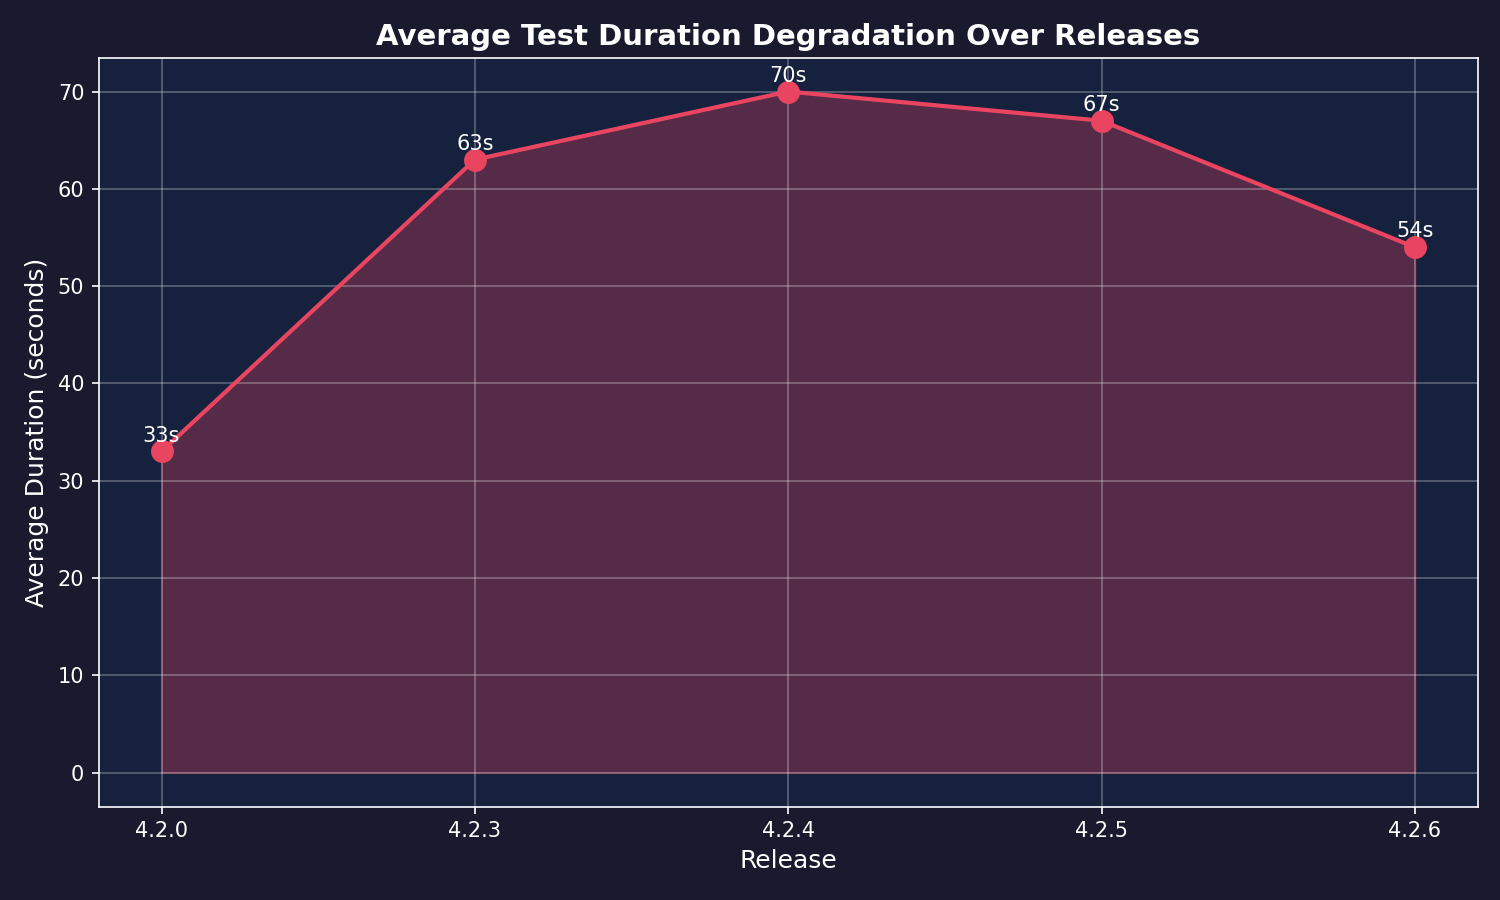
Haskell's journey across 5 releases:
- 4.2.0: 21 seconds (fast, consistent)
- 4.2.3: 58 seconds (2.8x slower)
- 4.2.4: 66 seconds (3.1x slower)
- 4.2.5: 106 seconds (5x slower)
- 4.2.6: 128 seconds (6.1x slower than baseline)
509.5% variance. For identical tests. The winner becomes the loser.
V's wild ride:
- 4.2.0: 22 seconds
- 4.2.3: 40 seconds
- 4.2.4: 49 seconds
- 4.2.5: 114 seconds (5.2x slower than baseline)
- 4.2.6: 58 seconds (back down, but still 2.6x baseline)
418.2% variance. V is a roller coaster.
Elixir's chaos:
- 4.2.0: 20 seconds (fast, efficient)
- 4.2.3: 69 seconds (3.5x slower)
- 4.2.4: 105 seconds (5.3x slower)
- 4.2.5: 55 seconds (back to reasonable)
- 4.2.6: 41 seconds (2x baseline)
425% variance. Up, down, all around.
C's performance:
- 4.2.0: 23 seconds
- 4.2.3: 107 seconds (4.7x slower)
- 4.2.4: 23 seconds (back to baseline)
- 4.2.5: 68 seconds (3x baseline)
- 4.2.6: 74 seconds (3.2x baseline)
365% variance. C didn't change. The infrastructure did.
No consistent pattern. Different languages win & lose in each run. The fastest language in one release becomes the slowest in the next. Haskell went from 21s to 128s. V spiked to 114s then dropped. Pure chaos.
the root cause
After digging through the reports, the culprit became clear: orchestrator placement on CPU-bound pool.
What's happening:
- GitLab runner (orchestrator) needs CPU to schedule & coordinate jobs
- Test jobs need CPU to compile, run tests, report results
- Both compete for limited CPU cycles on the same nodes
- Context switching & cache thrashing create unpredictable timing
- Matrix generation order becomes random as scheduler equilibrates
The anti-pattern:
❌ BAD:  [ORCHESTRATOR] + [TEST JOB 1] + [TEST JOB 2] ... on same CPU pool
✅ GOOD: [ORCHESTRATOR] on dedicated node, [TESTS] on separate pool
This violates fundamental SRE principles. You don't run the traffic cop in the middle of the highway.
why it's fun for chaos engineering
Here's the twist: from a chaos engineering perspective, this setup is perfect.
It reproduces real-world conditions:
- Resource contention (just like production)
- Non-deterministic scheduling (like when traffic spikes)
- Race conditions that only appear under load
- Timing bugs that slip through local testing
No two runs are identical. True chaos.
This tests:
- Retry logic robustness
- Flaky test detection systems
- Performance monitoring accuracy
- SLA adherence under adversarial conditions
For stress testing & finding edge cases? Keep this setup. For production CI/CD & meaningful benchmarks? Fix it immediately.
the experiments
The aggregated report uses dynamic version discovery & generates visualizations via UN's sandbox environment. Charts render using matplotlib in an isolated execution context, then return as artifacts.
Key insight: The methodology itself demonstrates UN's value. Generate reports with embedded execution, no local dependencies required.
Here's the pipeline:
# Discover all releases dynamically from git tags
VERSIONS=$(git tag | grep -E '^[0-9]+\.[0-9]+\.[0-9]+$' | sort -V)

# Copy performance data for each release
for v in $VERSIONS; do
  cp reports/$v/perf.json perf-$v.json
done

# Generate charts via UN (matplotlib in sandbox)
build/un -a -f perf-*.json scripts/generate-aggregated-charts.py

# Generate markdown report
python3 scripts/aggregate-performance-reports.py reports AGGREGATED-PERFORMANCE.md
Ever-growing analysis. Each new release automatically includes its data in the aggregated report. No hardcoded versions.
what other tests could we do?
This performance variance analysis opens doors for additional experiments:
1. orchestrator isolation study
Hypothesis: Separating orchestrator from compute pool reduces variance to <10%.
Test:
- Run 10 releases with orchestrator on CPU-bound pool (current setup)
- Run 10 releases with orchestrator on dedicated node
- Compare variance distributions
- Measure reduction in non-determinism
Expected outcome: Variance drops dramatically. Consistent language rankings emerge.
2. concurrency limit sweep
Hypothesis: Fixed concurrency limits stabilize performance at cost of total duration.
Test:
# GitLab .gitlab-ci.yml variations
trigger-test-matrix:
  parallel: [8, 16, 32, 64, 128, unlimited]
Run the full test suite at each concurrency level. Measure:
- Total pipeline duration
- Per-language variance
- Resource utilization
- Queue wait times
Expected outcome: Sweet spot exists where variance minimizes without excessive serialization.
3. language startup time profiling
Hypothesis: Dynamic languages show higher variance due to JIT/GC startup inconsistency.
Test:
- Add instrumentation to measure VM startup vs test execution time
- Separate cold start (first test) from warm runs (subsequent tests)
- Compare compiled languages (C, Rust, Go) vs dynamic (Python, Ruby, JavaScript)
Expected outcome: Dynamic languages show 2-3x variance in startup, compiled languages show <10% variance.
4. cache warming experiments
Hypothesis: Container image caching reduces variance for languages with heavy dependencies.
Test:
- Pre-warm Docker layer cache before matrix execution
- Measure performance with cold cache vs warm cache
- Track which languages benefit most from caching
Expected outcome: Languages with heavy ecosystems (JavaScript, Python) show largest improvements.
5. time-of-day variance analysis
Hypothesis: Infrastructure load varies by time, affecting CI performance.
Test:
- Trigger identical test runs every 2 hours for 1 week
- Tag each run with timestamp & day-of-week
- Correlate variance with calendar patterns
Expected outcome: Business hours show higher variance. Weekends & nights show more consistency.
6. resource contention simulation
Hypothesis: Artificial load mimics production chaos patterns.
Test:
- Run stress-ng or similar on CI nodes during test execution
- Vary CPU/memory/IO pressure levels
- Measure impact on test variance & failure rates
Expected outcome: Controlled chaos reveals which tests are brittle under load.
7. network partition tolerance
Hypothesis: Tests that depend on external resources show higher variance.
Test:
- Add network delay/jitter using tc (traffic control)
- Randomly drop packets at varying rates
- Measure which language implementations handle degradation gracefully
Expected outcome: Tests with proper timeout/retry logic maintain performance. Others fail or timeout.
8. compiler optimization impact
Hypothesis: Optimization flags affect not just speed but variance.
Test:
For compiled languages, run tests with:
- No optimization (-O0)
- Standard optimization (-O2)
- Aggressive optimization (-O3)
- Debug symbols vs stripped
Measure both performance & variance at each level.
Expected outcome: Higher optimization reduces variance by minimizing branching & improving cache locality.
9. memory pressure cascade
Hypothesis: Memory exhaustion on one test affects subsequent tests.
Test:
- Run tests with varying memory limits (cgroup constraints)
- Deliberately trigger OOM conditions
- Measure if failures cascade to unrelated tests
Expected outcome: Isolated test failures when using proper containerization. Cascading failures indicate shared state.
10. performance archaeology
Hypothesis: Historical variance patterns reveal infrastructure changes.
Test:
- Extend analysis back 50+ releases
- Correlate variance spikes with git commits, infrastructure changes, & CI config updates
- Build timeline of "what changed when"
Expected outcome: Variance spikes align with infrastructure migrations, runner updates, or Kubernetes upgrades.
beyond ci/cd: the laboratory awaits
The answer lies in the heart of battle.
That's what Ryu would say. Not about street fighting. About mastery. About the relentless pursuit of understanding through experimentation.
An UN environment with 42+ languages, REST API, SDK, isolated execution, artifact generation isn't just a CI/CD tool. It's a computational laboratory for science that was previously impossible or impractical.
Think about what you could do.
language shootout: the next generation
The classic language shootout died. The Computer Language Benchmarks Game was important, but limited. Local execution. Manual testing. Static benchmarks.
An UN brings the shootout back to life. But better.
Imagine:
# Submit identical algorithm to 42 languages simultaneously
build/un -a \
  -f algorithm.c \
  -f algorithm.py \
  -f algorithm.rs \
  -f algorithm.go \
  # ... 38 more languages
  benchmark-all.py

# Returns: execution time, memory usage, artifact size for each
Real-time cross-language benchmarking. Same problem. 42 solutions. Instant results.
Test sorting algorithms, search patterns, data structure performance, string manipulation, numeric computation, graph traversal, parsing efficiency.
No local setup. No environment conflicts. Pure measurement.
this is the laboratory. this is where we train.
algorithm correctness verification
Here's the real question: Does your algorithm actually work?
Not "does it compile." Not "does it pass tests locally." Does it produce identical results across 42 different language implementations?
The experiment:
# Implement quicksort in 42 languages
# Feed each the same unsorted array
# Compare outputs

build/un -a -f data.json quicksort-42.py

# Returns: 42 sorted arrays
# Diff them: should be identical
# If not: you found a language bug or algorithm mistake
This finds bugs in compilers, interpreters, & standard libraries.
Python's sort might handle edge cases differently than Rust's. JavaScript's number handling differs from C's. Lua's table sorting has different stability guarantees than Ruby's.
Cross-validate everything. Trust nothing until proven across ecosystems.
the permacomputer vision demands this level of truth.
numeric precision studies
Floating point arithmetic is not associative.
Everyone knows this. Few test it systematically.
The experiment:
# Calculate (a + b) + c vs a + (b + c) in 42 languages
# Where a=1e20, b=-1e20, c=1.0

# Some languages: result = 1.0
# Others: result = 0.0
# Which is "correct"? Neither. Both.
Test across: - Different precision levels (float32, float64, decimal, bignum) - Different rounding modes - Different math libraries - Different CPU architectures
Map the numeric landscape. Know exactly where precision breaks down in each language.
For scientific computing, this isn't academic. This is survival.
you cannot master what you do not measure.
cryptographic primitive performance
Security has a cost. How much?
An UN lets you measure encryption/decryption, hashing, signing, key generation across every language simultaneously.
The experiment:
Task: Hash 1GB of data using SHA-256

Run across:
- C (OpenSSL)
- Rust (ring)
- Go (crypto/sha256)
- Python (hashlib)
- JavaScript (crypto)
- ... 37 more implementations

Measure:
- Throughput (MB/s)
- CPU utilization
- Memory overhead
- Implementation correctness
Which language gives you security without sacrificing speed?
The answer isn't obvious. Native implementations differ wildly. Some languages optimize hash functions. Others don't.
You need data. an UN provides it.
parallel processing patterns
Concurrency is hard. Different languages approach it differently.
- C: pthreads
- Go: goroutines
- Rust: async/await
- Erlang: processes
- Python: multiprocessing/threading/asyncio
- JavaScript: workers/async
The experiment:
Implement producer-consumer pattern in 42 languages. Measure: - Throughput under contention - Context switch overhead - Deadlock susceptibility - Memory scaling
Feed identical workload (10,000 tasks, 1ms each) to each implementation.
Which paradigm wins? Depends on workload. But you'll have 42 data points instead of guessing.
the path to mastery requires confronting every opponent.
compiler optimization archaeology
What does -O3 really do?
The experiment:
# Same C code compiled with different flags
# Execute via UN
# Compare:
# - Binary size
# - Execution time
# - Memory usage
# - CPU instructions (if available)

build/un -a \
  -f program-O0.bin \
  -f program-O1.bin \
  -f program-O2.bin \
  -f program-O3.bin \
  -f program-Ofast.bin \
  analyze-optimizations.py
Do this for GCC, Clang, Intel ICC, MSVC, Zig, Rust.
Map the optimization landscape.
Sometimes -O3 makes code slower (instruction cache misses, excessive inlining). Sometimes -Os beats -O3 (better cache utilization).
You won't know until you measure. Across compilers. Across versions. Across architectures.
standard library comparison
Not all sort() functions are equal.
The experiment:
# Sort identical arrays in 42 languages
# Measure:
# - Time complexity in practice (not just theory)
# - Stability (do equal elements maintain order?)
# - Memory overhead
# - Best/average/worst case behavior
Feed pathological inputs: - Already sorted - Reverse sorted - All identical elements - Nearly sorted with few swaps - Random data
Which languages have timsort? quicksort? mergesort? heapsort?
Which lie about their time complexity?
Some standard libraries make trade-offs you don't expect. The only way to know: test everything.
machine learning across languages
Train the same model in TensorFlow (Python), PyTorch (Python), Flux (Julia), Torch (Lua).
Feed identical training data. Measure: - Training time - Inference speed - Model accuracy - Memory consumption - Gradient precision
Does Julia actually outperform Python for ML? Test it.
Does quantization hurt accuracy? Measure it across 5 languages, 10 model architectures.
an UN makes this trivial. Submit training jobs to multiple languages. Compare artifacts.
Science requires controlled experiments. This is controlled at the language level.
regex engine performance
Regular expressions vary wildly across languages.
The experiment:
Regex: (a+)+b
Input: "aaaaaaaaaaaaaaaaaaaac"

Expected: No match
Reality: Some engines take MINUTES (catastrophic backtracking)
Test this across 42 languages. Measure: - Matching time - Memory usage - Backtracking behavior - Unicode handling - Capture group performance
Which regex engines are safe for untrusted input?
Which optimize pathological patterns?
You need to know. Especially if you're building parsers, validators, security tools.
an UN gives you the testing ground.
garbage collection pressure testing
GC pauses kill latency.
The experiment:
# Allocate 1 million objects
# Measure pause times
# Across: Python, Ruby, JavaScript, Java, Go, C#, OCaml, Haskell

# Track:
# - GC pause frequency
# - Maximum pause duration
# - Total GC overhead
# - Memory bloat
Which languages deliver consistent sub-millisecond pauses?
Which have unpredictable stop-the-world collection?
For real-time systems, this matters more than raw speed.
Test it systematically. Not anecdotes. Data.
parser combinator comparison
Parsing is foundational.
Implement the same grammar (JSON, TOML, INI, custom DSL) using parser combinators in:
- Haskell (Parsec)
- Rust (nom)
- Python (pyparsing)
- Scala (fastparse)
- F# (FParsec)
Measure: - Parse speed - Error messages quality - Memory usage - Code complexity (lines of code)
Which approach gives you speed, clarity, & good errors?
an UN lets you compare 42 implementations instead of guessing based on documentation.
string encoding chaos
Unicode is hard. Every language handles it differently.
The experiment:
String: "🔥💻🚀"

Questions:
- How many characters? (3 grapheme clusters)
- How many code points? (3)
- How many bytes in UTF-8? (12)
- How many in UTF-16? (6)
- How many in UTF-32? (12)
Ask 42 languages to answer these questions. Compare results.
JavaScript says .length = 6 (counts UTF-16 code units). Python 3 says len() = 3 (counts Unicode code points). C counts bytes.
Which is correct? All. None. Depends on definition.
Test emoji, combining characters, RTL text, zero-width joiners.
Find the edge cases. Document the behavior. Build the truth table.
json parsing conformance
Is your JSON parser standards-compliant?
The experiment:
# Feed pathological JSON to 42 parsers
# Test cases:
# - Deeply nested objects (10,000 levels)
# - Large numbers (2^1000)
# - Unicode edge cases
# - Duplicate keys
# - Trailing commas
# - Comments (not in spec)
Which parsers crash? Which accept invalid JSON? Which reject valid JSON?
an UN makes this a single command:
build/un -a -f test-cases.json json-torture-test.py
Returns: 42 reports on parser behavior.
Build the definitive JSON compatibility matrix.
sorting stability verification
Stable sorts maintain relative order of equal elements.
Does your language's sort() actually guarantee stability?
The experiment:
data = [(1, "a"), (1, "b"), (1, "c"), (2, "d")]
sorted_data = sort(data, key=lambda x: x[0])

# Expected (stable): [(1, "a"), (1, "b"), (1, "c"), (2, "d")]
# Possible (unstable): [(1, "c"), (1, "b"), (1, "a"), (2, "d")]
Test across 42 languages. Document which provide stable sorts by default.
Hint: Many don't. Or they document stability but don't guarantee it across versions.
Verify. Don't trust.
datetime edge cases
Time is complicated.
The experiment:
Questions:
- How many days in February 2100? (28, it's not a leap year)
- What time is it during DST transition? (2:30am doesn't exist)
- How do you add 1 month to January 31st? (February 31st doesn't exist)
- What's the timestamp for December 31, 9999 23:59:59? (Some languages overflow)
Ask 42 languages. Compare answers.
Which handle leap seconds? Which ignore them?
Which crash on timezone edge cases?
Build the authoritative guide to datetime behavior across ecosystems.
the permacomputer demands truth
The permacomputer manifesto defines four operating values:
Truth - Source code must be openly available. Implementations must be verifiable.
Freedom - Voluntary participation. No vendor lock-in.
Harmony - Minimal waste. Self-renewing through diverse connections.
Love - Individual freedoms function through compassion & cooperation.
an UN embodies these values.
42+ languages. REST API. Open SDK. Isolated execution. Anyone can verify results. Anyone can submit experiments.
This is the laboratory for the permacomputer era. Visit unsandbox.com to start experimenting.
No gatekeepers. No licenses. No corporate control. Just code, execution, & truth through measurement.
Like Ryu perfecting the hadouken, we perfect our understanding through endless experimentation.
Not once. Not ten times. Forty-two implementations. Measured. Compared. Verified.
the warrior's path
"The answer lies in the heart of battle."
Ryu doesn't hope his technique works. He doesn't read about it. He doesn't trust documentation.
He tests it. Against every opponent. In every condition. Until mastery.
That's the approach an UN enables for computational science.
- Don't assume Python is slow. Measure it.
- Don't trust that Rust is safe. Verify it.
- Don't believe Go has good concurrency. Test it against Erlang.
- Don't accept that C is fast. Compare it to Zig, to Rust, to hand-optimized assembly.
Science demands evidence. An UN provides the arena.
42 languages. That's 42 chances to find the truth. 42 perspectives on the same problem. 42 ways to expose assumptions.
This is not automation. This is enlightenment through measurement.
Every experiment reveals something. Every comparison exposes a truth previously hidden. Every benchmark challenges what you thought you knew.
You cannot master what you do not measure.
You cannot measure what you cannot execute.
An UN removes the barrier between question & answer.
the research that awaits
Imagine the papers you could write:
- "Comparative Analysis of Floating Point Precision Across 42 Language Implementations"
- "Garbage Collection Latency: A Multi-Language Study"
- "Regular Expression Engine Security: Catastrophic Backtracking in the Wild"
- "JSON Parser Conformance: 42 Implementations Tested Against RFC 8259"
- "Sorting Algorithm Performance & Stability Across Programming Ecosystems"
- "Unicode Handling: A Survey of Character Encoding Behavior"
- "Cryptographic Primitive Performance: Cross-Language Benchmarking"
These papers don't exist because running experiments across 42 languages is too hard. Local setup. Dependency hell. Environment inconsistencies.
An UN solves this. Submit experiments. Get results. Focus on science, not infrastructure.
The computational laboratory has been waiting. Now it's accessible via REST API. Start at unsandbox.com.
the value of chaos
Most teams want stable, predictable CI/CD pipelines. Understandably. But intentional chaos has value:
- Reveals hidden assumptions
- Tests recovery mechanisms
- Finds race conditions
- Validates monitoring & alerting
- Builds confidence in system resilience
The UN Inception variance isn't a bug. It's a feature. A window into how systems behave under real-world conditions.
For production benchmarks: Fix the orchestrator placement, set explicit concurrency, isolate resources.
For chaos testing: Keep it exactly as-is. Let the scheduler gods do their worst.
reproducibility
The entire analysis pipeline is reproducible:
# Clone the repo
git clone https://git.unturf.com/engineering/unturf/un-inception.git
cd un-inception

# Generate the report
make perf-aggregate-report
This generates:
- AGGREGATED-PERFORMANCE.md - Full analysis
- reports/aggregated-*.png - Visualizations
Charts render via UN's sandbox environment. No local matplotlib installation needed.
Step back in time:
git checkout <commit-sha>
make perf-aggregate-report
Regenerate historical reports using the exact code & data from any point in history.
future work
Next steps for this analysis:
- Implement orchestrator isolation & measure impact
- Add real-time variance tracking to CI dashboard
- Correlate variance with infrastructure metrics (CPU, memory, network)
- Build prediction model for expected variance ranges
- Alert when variance exceeds thresholds (signal vs noise)
- Extend to other projects beyond UN Inception
The goal isn't zero variance. That's impossible in distributed systems. The goal is understood, bounded, predictable variance.
When variance exceeds expectations, that's signal. Something changed. Time to investigate.
conclusion
Performance variance isn't always bad. Context matters.
For UN Inception, the variance revealed an architectural anti-pattern (orchestrator placement) while simultaneously creating an excellent chaos testing environment.
The lesson: Measure, analyze, understand. Don't just chase lower numbers. Understand why the numbers vary.
And when in doubt, run more experiments.
read the full report
The complete analysis with methodology, raw data, & reproducibility instructions:
AGGREGATED-PERFORMANCE.md on git.unturf.com
The report auto-updates on each release tag via GitLab CI. Living documentation that grows with the project.